Occupancy⋯
64.7%+0.6
Data & Business Intelligence
From raw data to decisions people act on
Insightra helps you prepare, present, and tell stories with data. Learn with an e-book, work faster with a ready-made kit, or have a dashboard built for your team.
Learning materials in Bahasa Indonesia · Concepts work in any tool
Experience building dashboards for teams at
 Nabati Group
 Van Oord
What often happens
The data is right, but nobody uses it
These three problems come up again and again, in university reports and in office meetings alike.
Nobody opens the dashboard
It took weeks to build, yet nobody opens it. Lots of content, no message.
"So what's the point?"
The charts are neat and the numbers are right, but readers still ask what it means and what to do next.
Meetings without decisions
Every number is shown, nothing is highlighted. The meeting ends and the decision is postponed again.
Often the problem isn't the data. It's how the data is presented.
Products & services
Three ways Insightra helps
Learn it yourself, speed up your work, or have it built for you.
E-book
Data Visualization Fundamentals
Learn to present data through 13 industry cases, from banking to automotive. Written in Bahasa Indonesia.
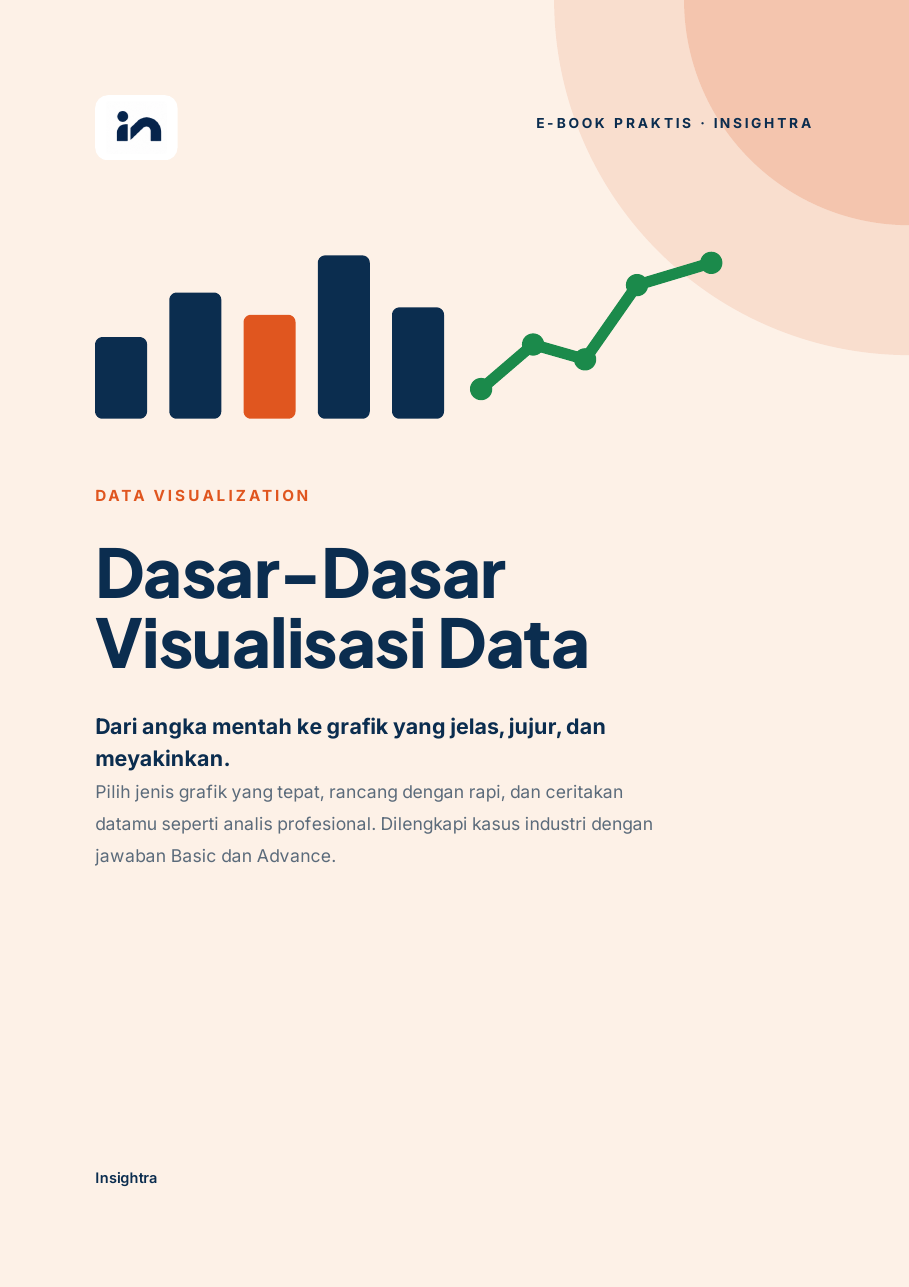
- 89 pages, 13 chapters, 3 parts
- 13 industry cases, two answer levels
- A 10-question checklist before you share a chart
- Glossary of 49 terms
Buy on Lynk.id
PDF file, readable on phone or laptop
Toolkit
BI Starter Kit
Ready-made themes, icons, and backgrounds that make your Power BI report look polished in minutes.
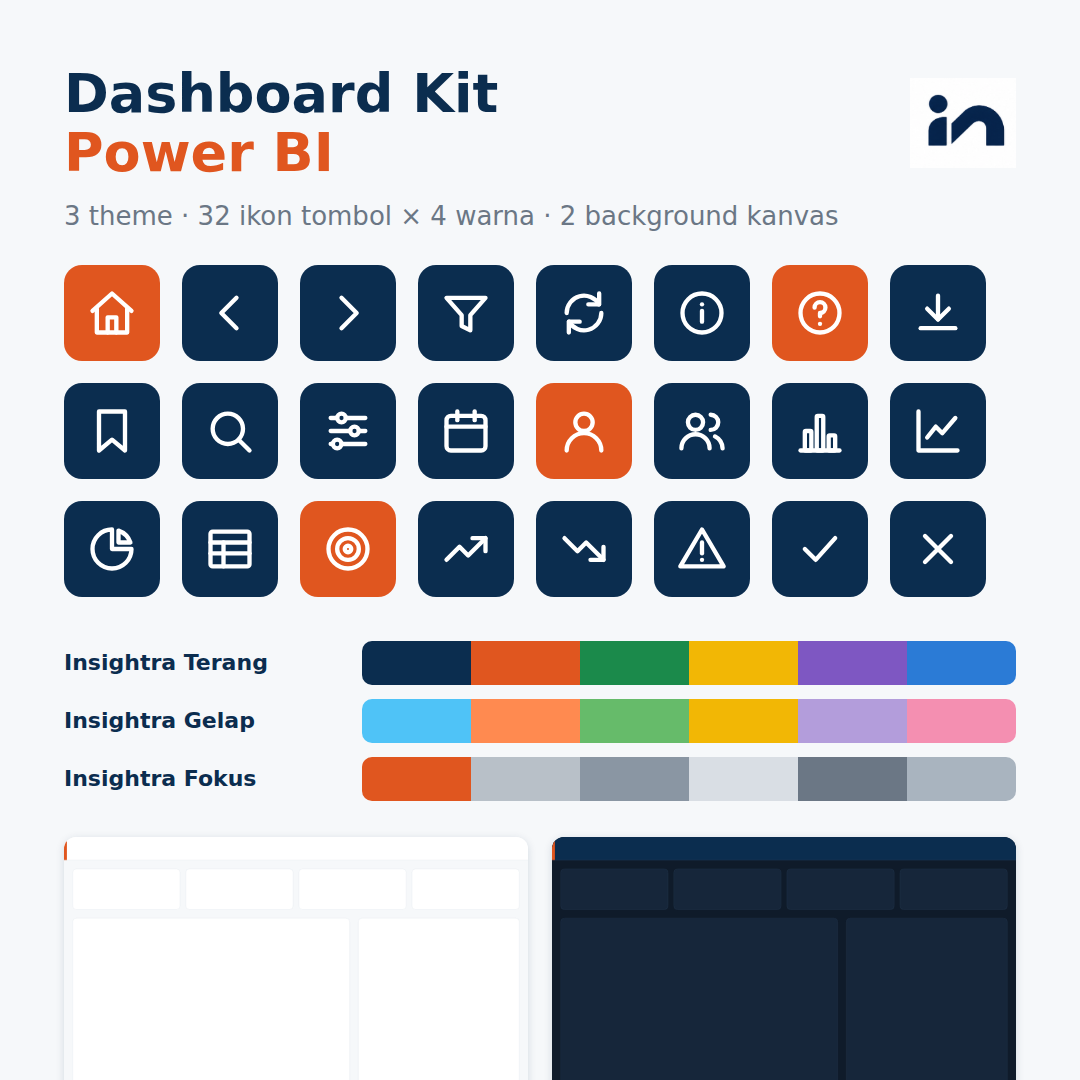
- 3 Power BI themes: Light, Dark, Focus
- 32 button icons in 4 colors, PNG and SVG
- 2 canvas backgrounds, 1280×720
- Setup guide (in Bahasa Indonesia)
Ask about this kit
Coming soon on Lynk.id
Service
Dashboard Consulting & Development
Power BI dashboards designed and built around the decisions your team needs to make.
- Metric and KPI design with your team
- Power BI dashboard development
- Data model and performance clean-up
- Handover and user training
Get in touch
You will get a proposed plan in reply
How the service works
Four steps, from first chat to daily use
Dashboards are built from the decisions you need to make, not from the list of metrics that happen to exist.
1
Initial consultation
We discuss which decisions you need to make, who will read the dashboard, and what data you already have.
2
Design the metrics
We agree on every metric definition and the page layout before a single chart is built.
3
Build the dashboard
The data model and Power BI dashboard are built, with revisions at every stage.
4
Handover
Documentation, user training for your team, and support in the early weeks.
Portfolio
Sample dashboards built by Insightra
Three sample Power BI report pages for the most common needs. Choose a tab to view each one.
 Sales Performance
Year: 2026 ▾Region: All ▾
SalesIDR 12.4B96% of target
Annual growth+8.2%up from 2025
Active customers3,418last 12 months
Average transactionIDR 362Kper receipt
SummaryBy regionBy product
Operations & SLAMonth: Oct 2026 ▾Route: All ▾
On time90.3%target 95%
Average delivery time2.3 dayslimit 3 days
Late parcels1,441of 14,930 parcels
Complaint rate0.8%down 0.2 pts
| Route | Volume | Past SLA |
|---|---|---|
| Bandung | 5,920 | 3% |
| Surabaya | 4,880 | 6% |
| Medan | 2,410 | 21% |
| Makassar | 1,720 | 27% |
SummaryBy routeComplaints
FinanceYear: 2026 ▾Unit: All ▾
RevenueIDR 48.2B+2.6% vs budget
CostsIDR 39.6B+7.0% vs budget
ProfitIDR 8.6Bbudget IDR 10.0B
Profit margin17.8%of revenue
| Unit | Budget | Actual |
|---|---|---|
| Production | 22.4 | 24.5 |
| Logistics | 6.8 | 7.5 |
| Marketing | 4.2 | 4.1 |
| General | 3.6 | 3.5 |
SummaryBy unitCash flow
Sample dashboard views built by Insightra. All figures and names are fictional.
Experience building dashboards for teams at

Founder of Insightra
Tuhu Thufail Satria Abdi Nagara
Business Intelligence Engineer
Power BIDAXPower QueryData modeling
Power AppsPower AutomateBusiness analysis
View LinkedIn profile
About Insightra
Helping beginners level up with data
Insightra exists for one thing: helping people who are just starting out learn how to prepare, present, and tell stories with data, so their work is trusted and their careers grow.
Tuhu currently works as a Business Intelligence Engineer at Van Oord, designing and building Power BI dashboards that help teams make decisions. Before that, Tuhu spent more than four years at Nabati, from management trainee to operational excellence specialist in R&D, analyzing business processes and designing digital solutions.
1
Prepare
Turn raw data into a shape that is ready to read and calculate.
2
Present
Choose charts that are accurate, honest, and easy for anyone to read.
3
Tell the story
Turn findings into recommendations that lead people to decide.
Experience
- Jan 2026 – present Business Intelligence EngineerVan Oord · Jakarta
- Nov 2023 – Dec 2025 Operational Excellence Specialist, R&DPT Kaldu Sari Nabati Indonesia · Bandung
- Jan 2023 – Oct 2023 Process Engineer Specialist, R&DPT Kaldu Sari Nabati Indonesia · Bandung
- Nov 2021 – Dec 2022 Management TraineePT Kaldu Sari Nabati Indonesia · Bandung
- 2019 – 2020 Teaching assistant & laboratory coordinatorInstitut Teknologi Bandung
Education

Bachelor of Food Engineering, Cum Laude
Institut Teknologi Bandung · 2017 – 2021
Certifications & awards
- 15 licenses and certifications, including Power Apps and Power Automate (Udemy, 2025)
- Top 12 ideas, Engineering Innovation Challenge, National Engineering Day 2020 (Institution of Engineers Singapore & Science Centre Singapore)
- Top 10 papers, Seafast – Indofood Food Product Development Competition 2020
Languages
Indonesian (native) · English (professional working proficiency)
FAQ
Frequently asked questions
Yes. Each e-book chapter starts with the basic concept, followed by a real case with two answer levels. Technical terms are explained in the glossary. The e-book is written in Bahasa Indonesia.
No. The e-book teaches chart design decisions, not how to build them in a specific tool. The concepts work in any tool. If you need a ready-made kit for Power BI, see the BI Starter Kit.
No. There is a chapter on confidence intervals and sample size, but hypothesis testing, p-values, and regression are not covered.
It depends on the number of pages, how clean the data sources are, and the number of revisions. A time estimate is given after the initial consultation, once the needs are clear.
The main focus is Power BI, including DAX, Power Query, and data modeling. Tell us what you need through the contact form so we can see whether it's a good fit.
Fill in the contact form with a short overview: which decisions you need to make, who will read the dashboard, and what data you already have. The reply is sent to your email, with proposed next steps and an estimated scope of work.
Contact
Tell us what you need
Fill in this form and your message goes straight to Tuhu. The reply is sent to the email you enter.
Prefer to start learning on your own? See the e-book on Lynk.id